Settings
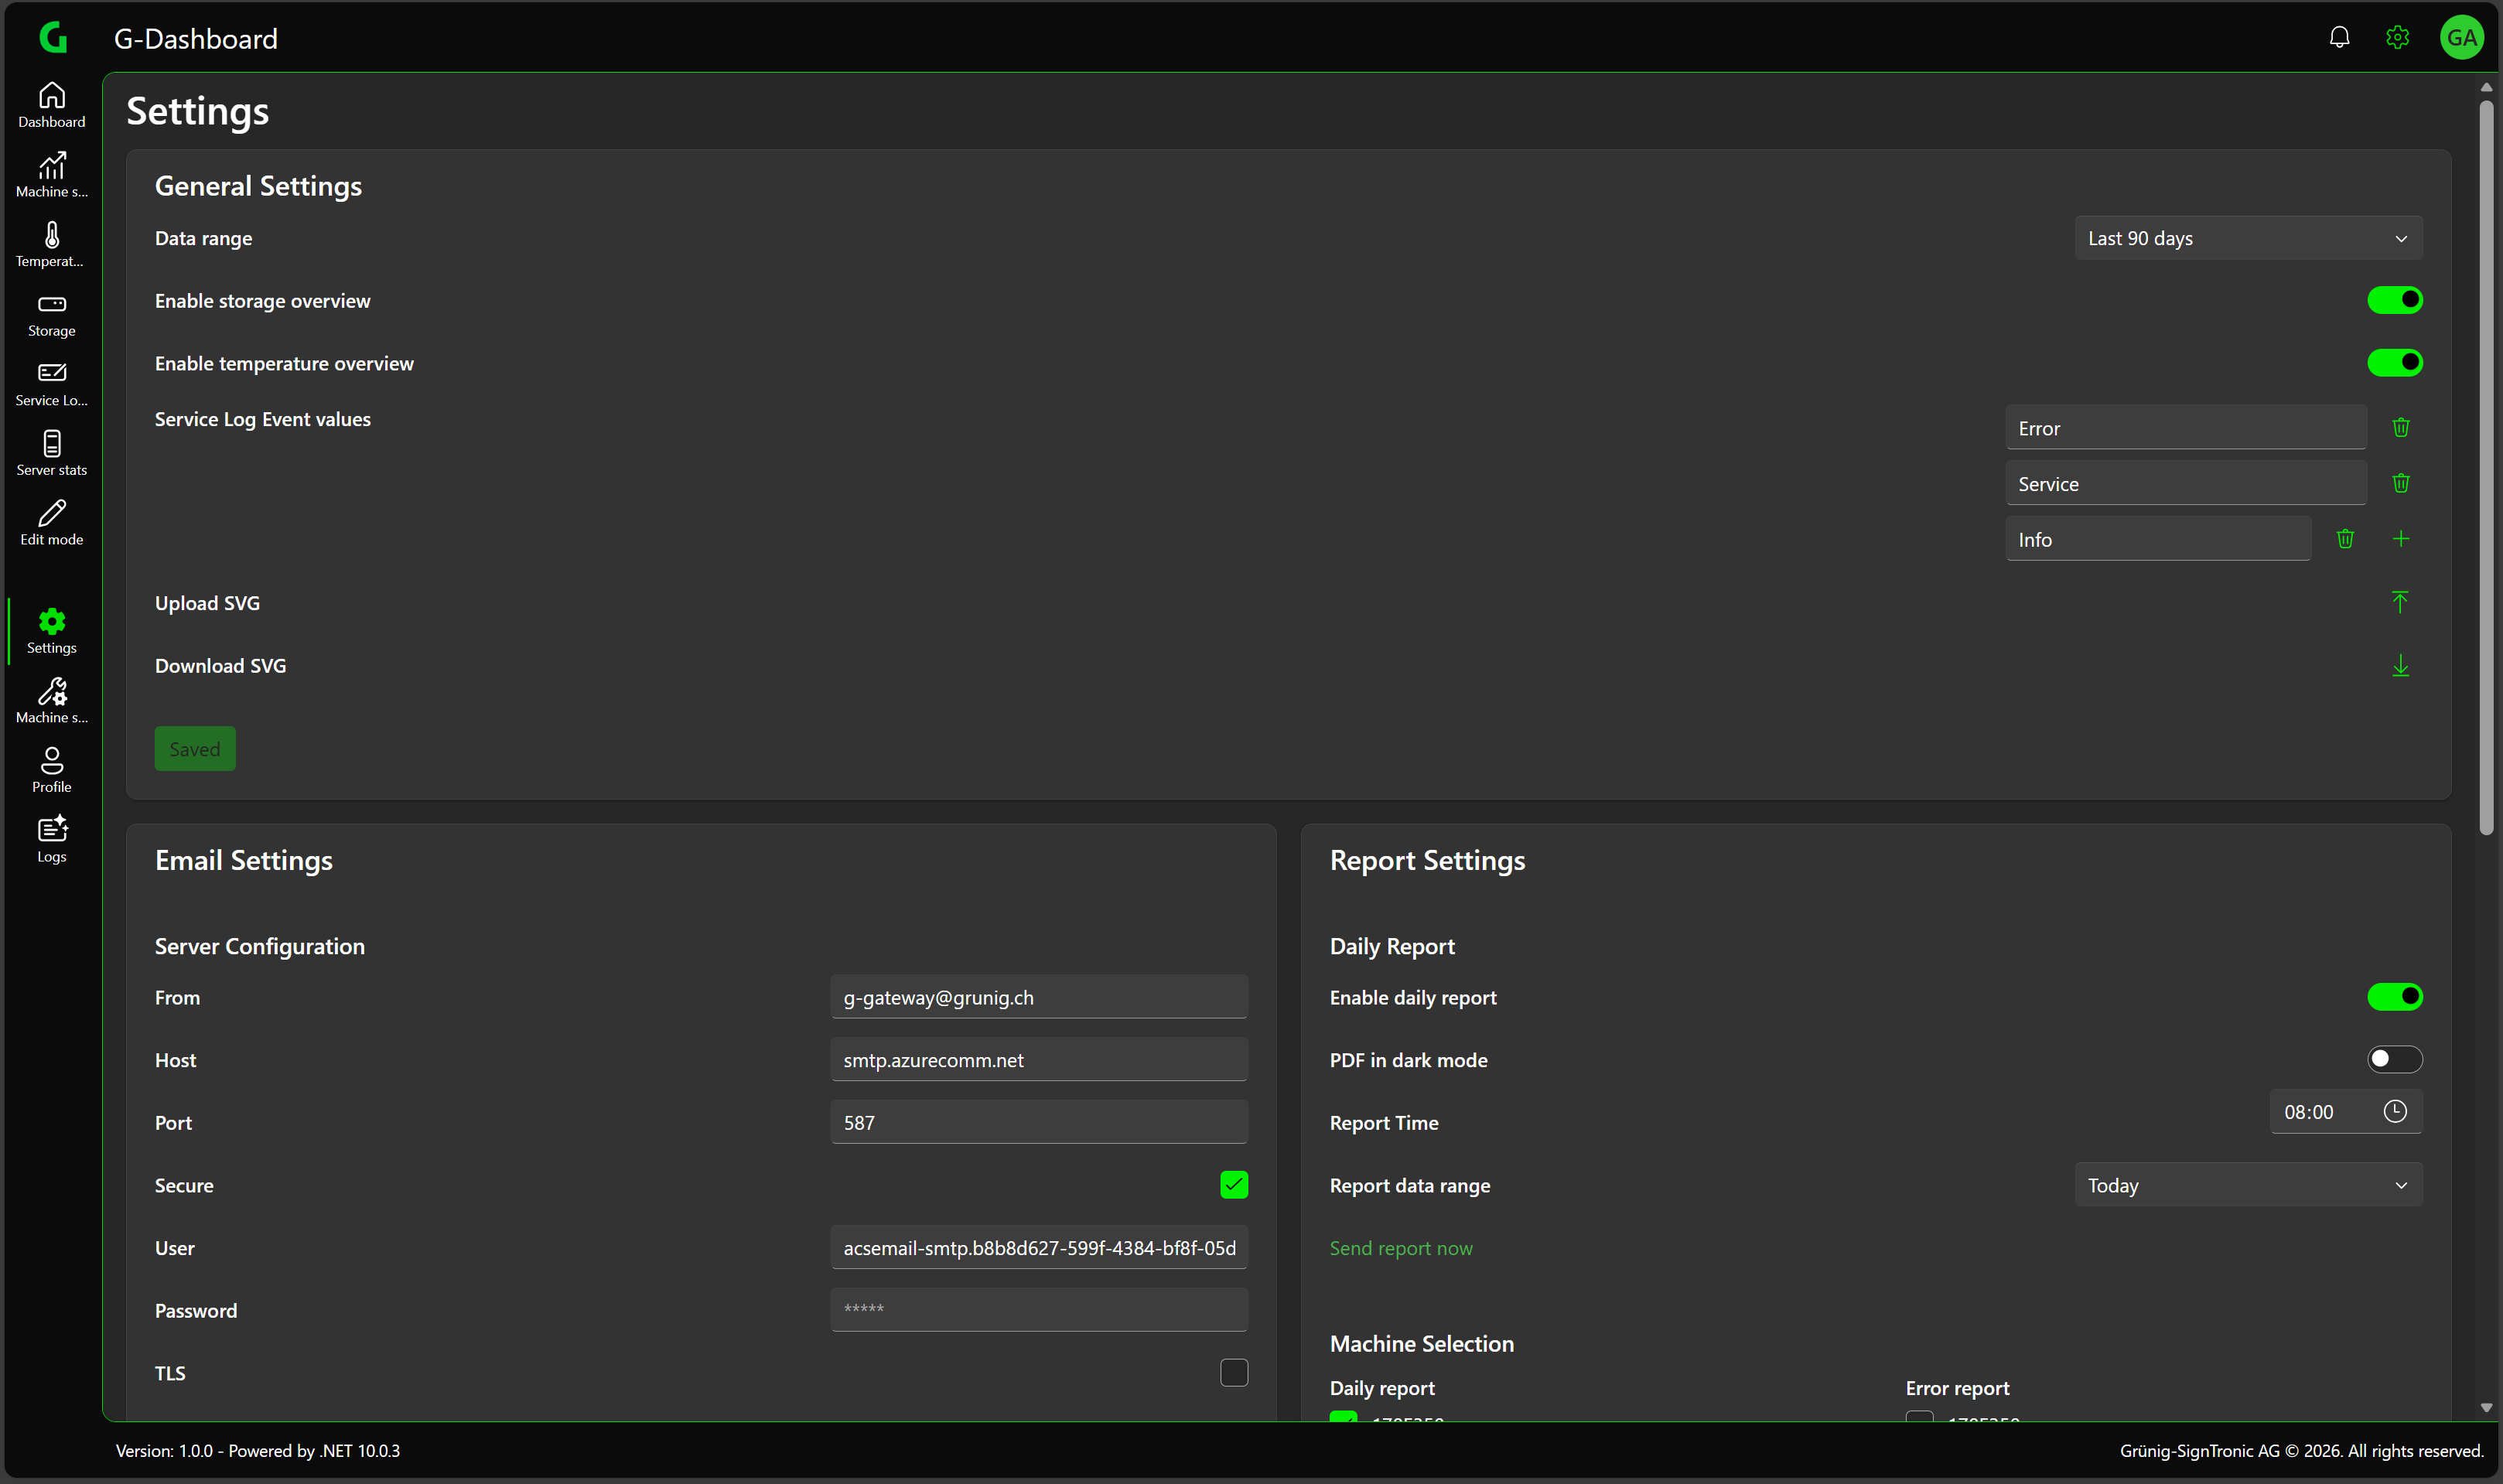
General Settings
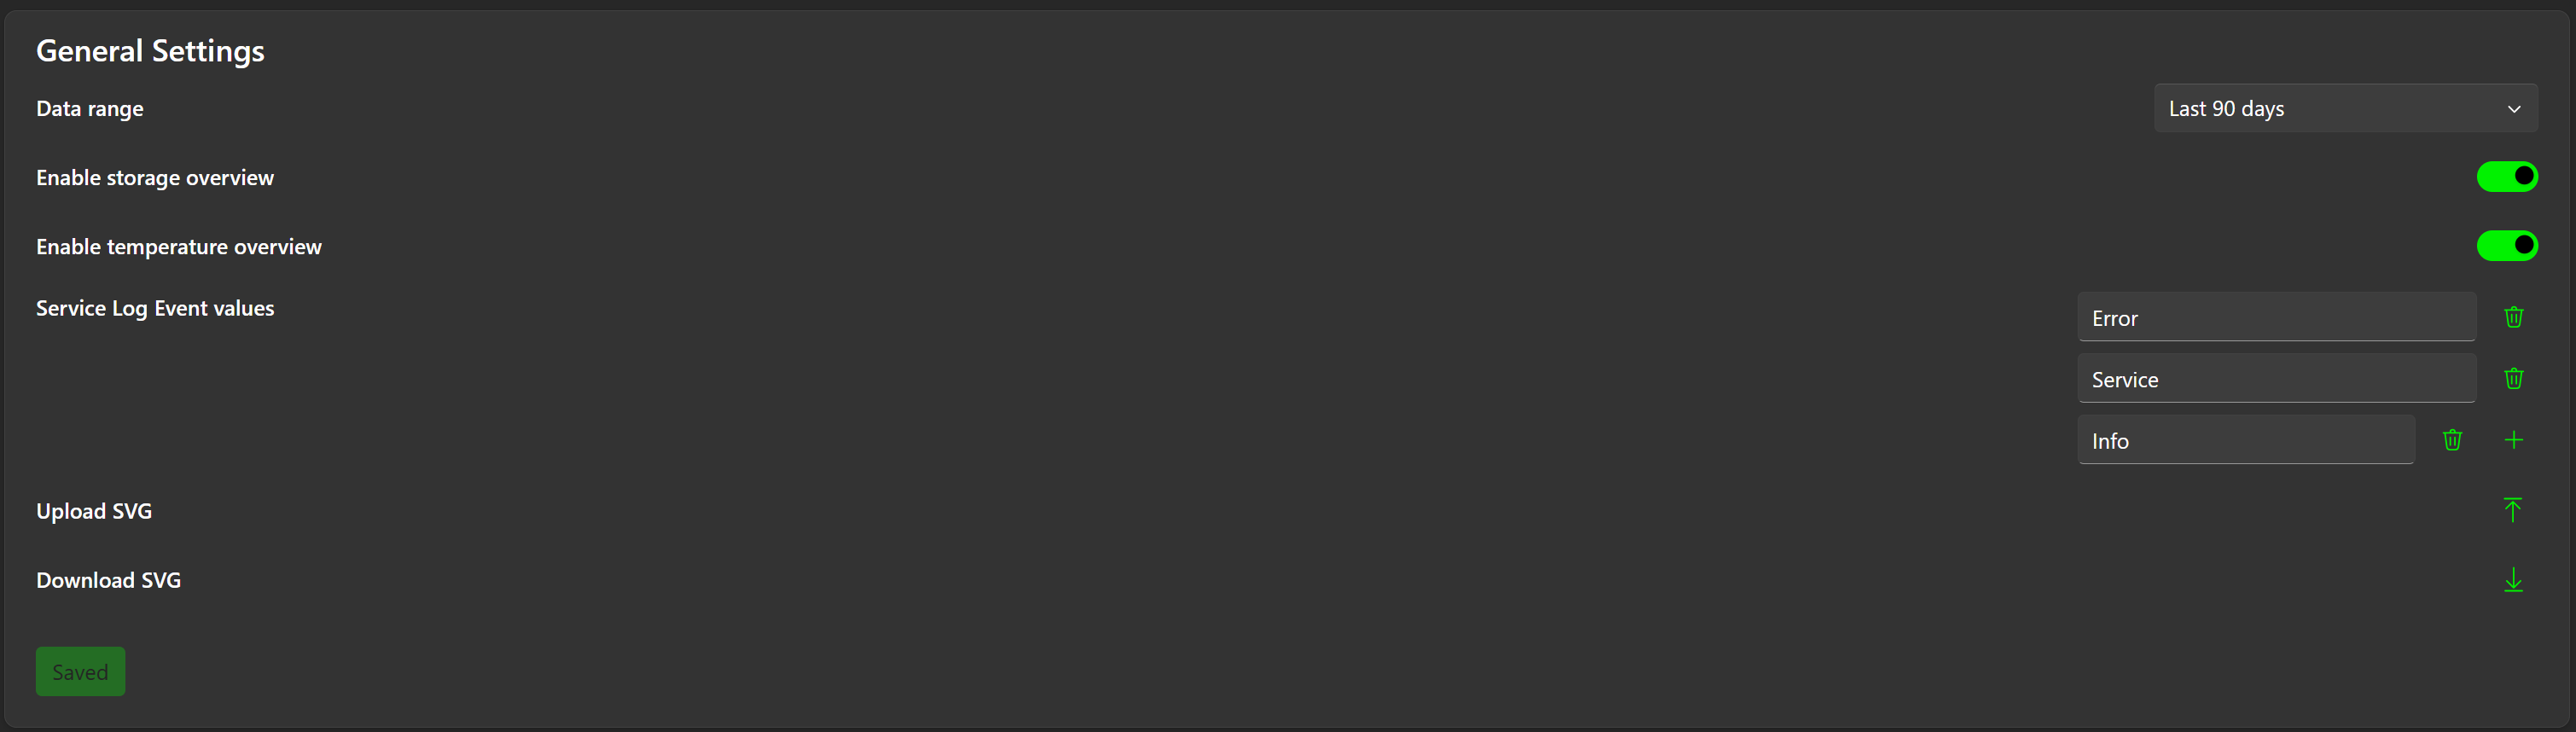
Data range
Here you can select the time range for which the data should be displayed.

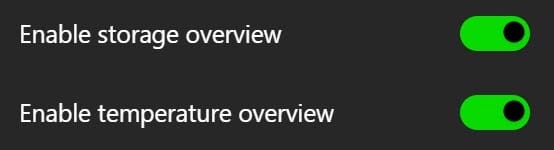
Enable storage / temperature overview
Here you can enable or disable the storage overview and the temperature overview (if available).
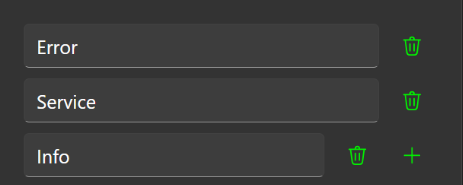
Service Log values
Defines the values that can be selected as events in the Service Protocol pop-up.
Download SVG
Downloads the current dashboard visualization. The file is saved in the device’s Downloads folder.

Email Settings
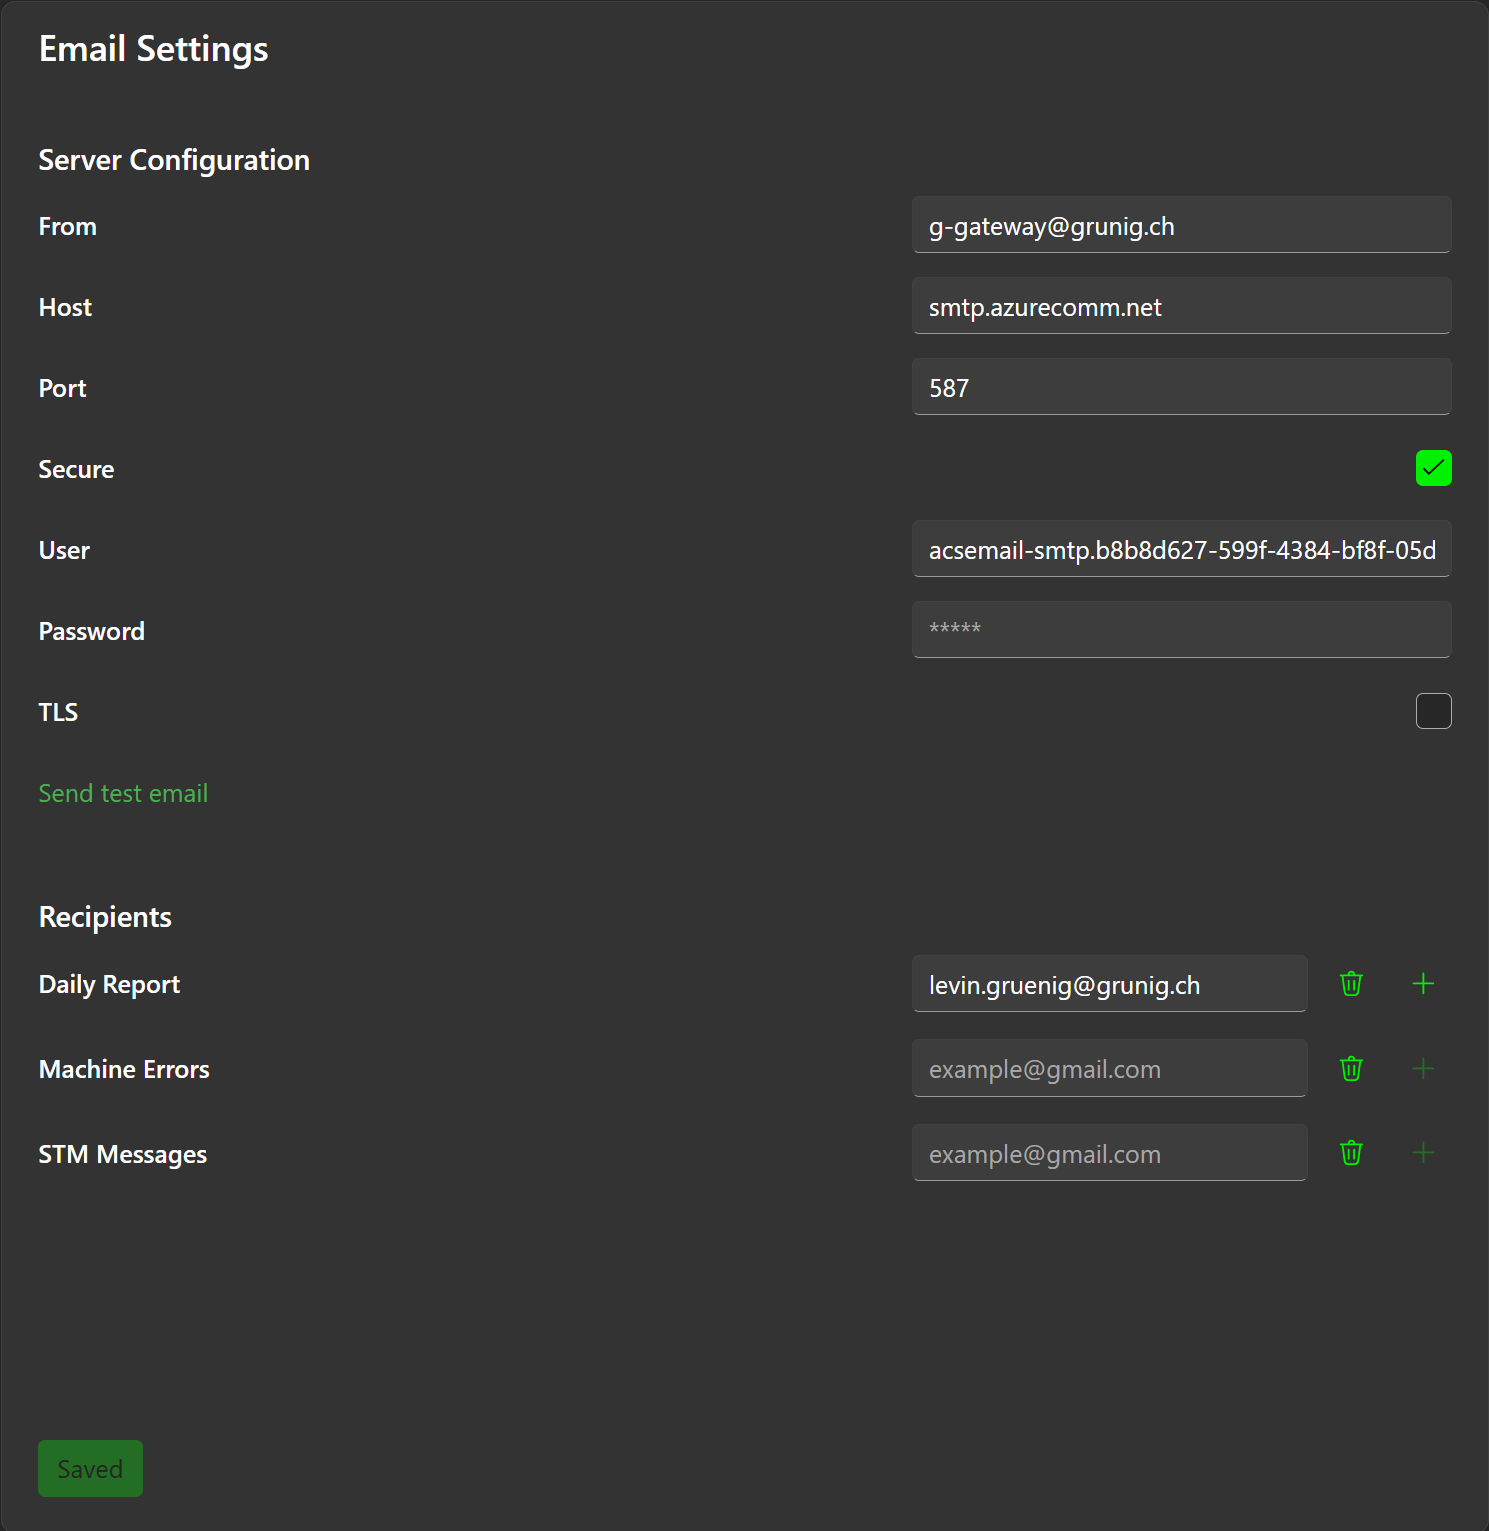
Server Configuration
Enter your SMTP server configuration here.
Recipients
Defines which reports are sent to which email addresses.
Report Settings
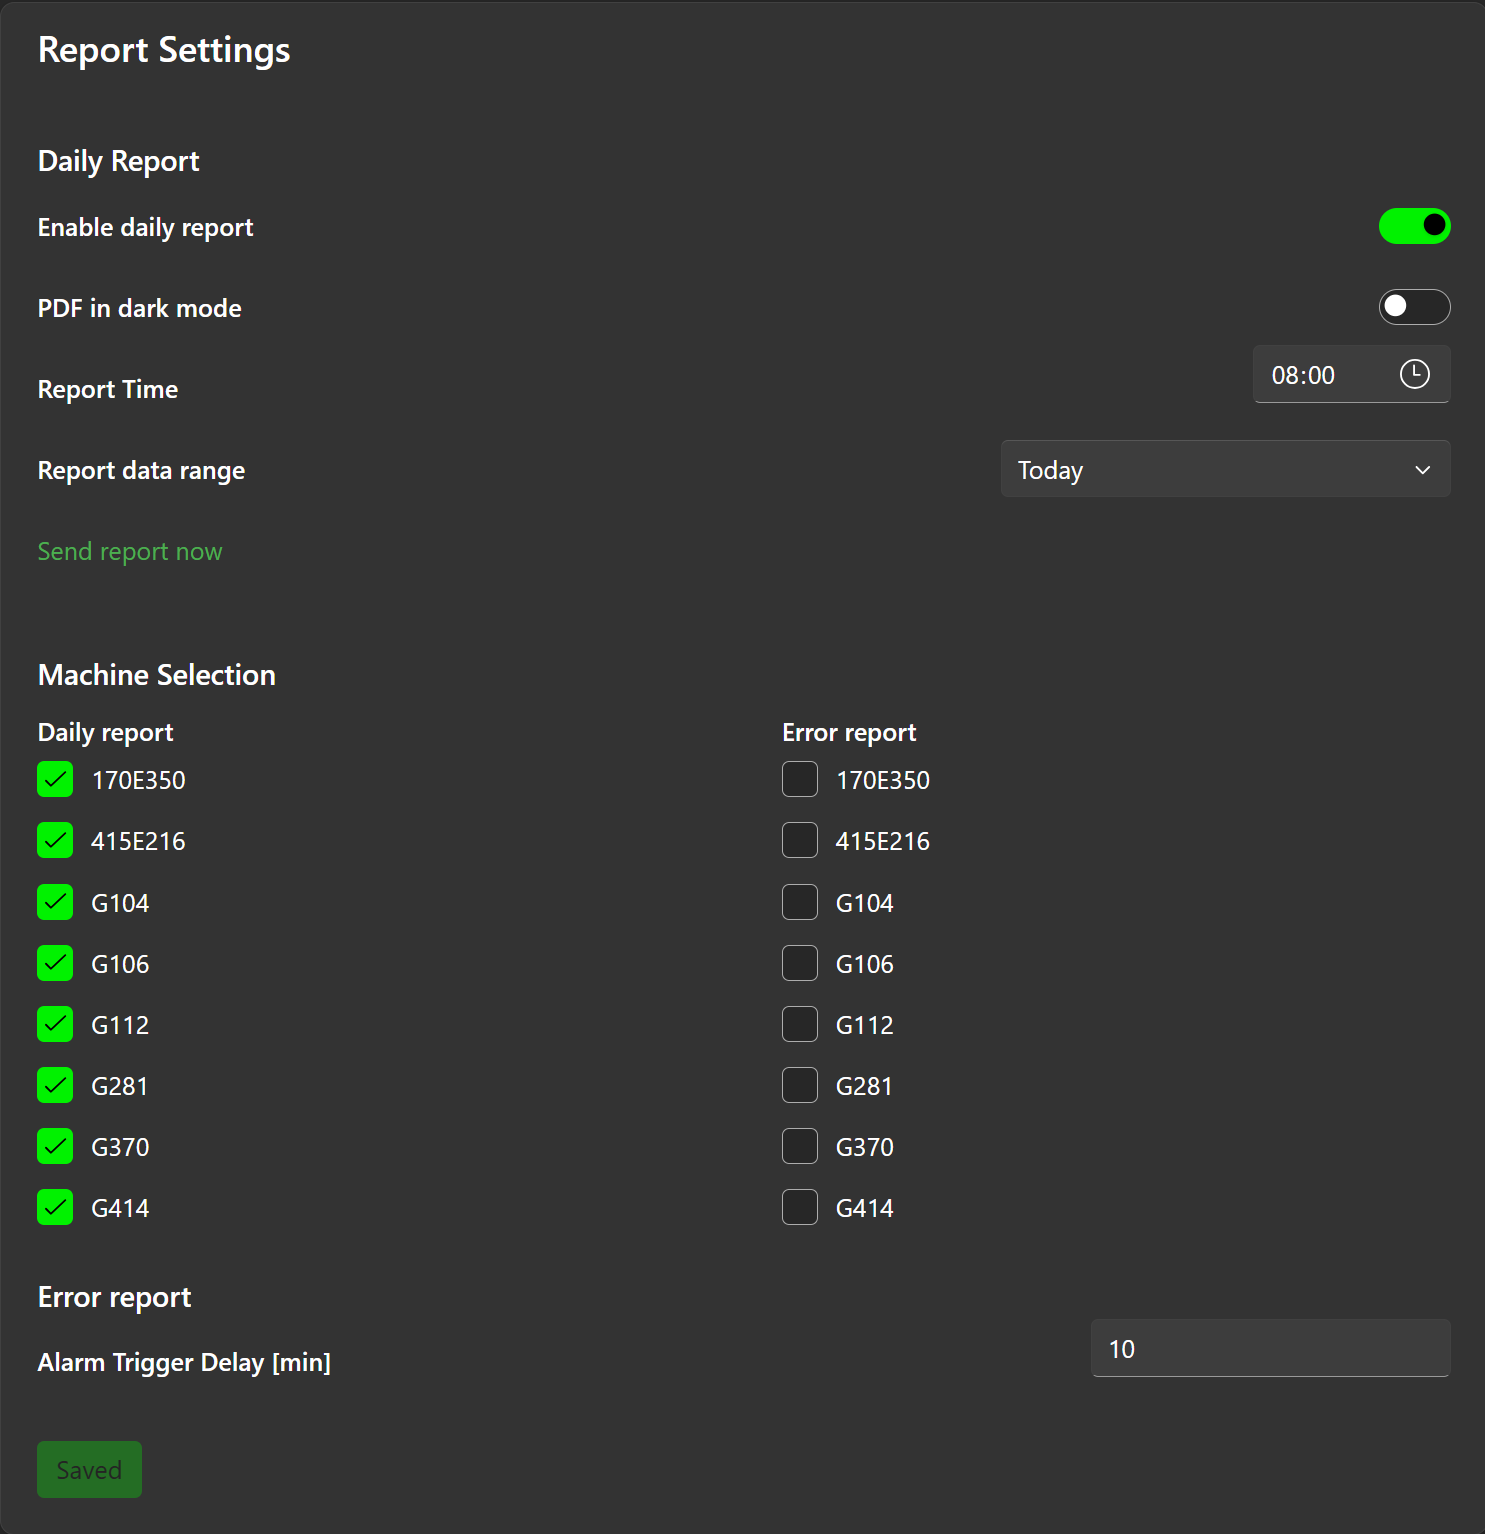
Enable daily report
Should the report function be active or inactive.
PDF in dark mode
The PDF can also be sent in dark mode, but this is not recommended if you want to print the report.
Report Time
The time when the report should be sent.
Report data range
Today's or yesterday's data? If Report time is selected in the morning then it makes more sense to select yesterday's data, if Report time is selected in the evening then today's data can also be selected.
Send report now
When this button is clicked, a report with the current settings is created and sent. This may take a few minutes.
Machine Selection
Here you can select the machines for which the report or error report is created.
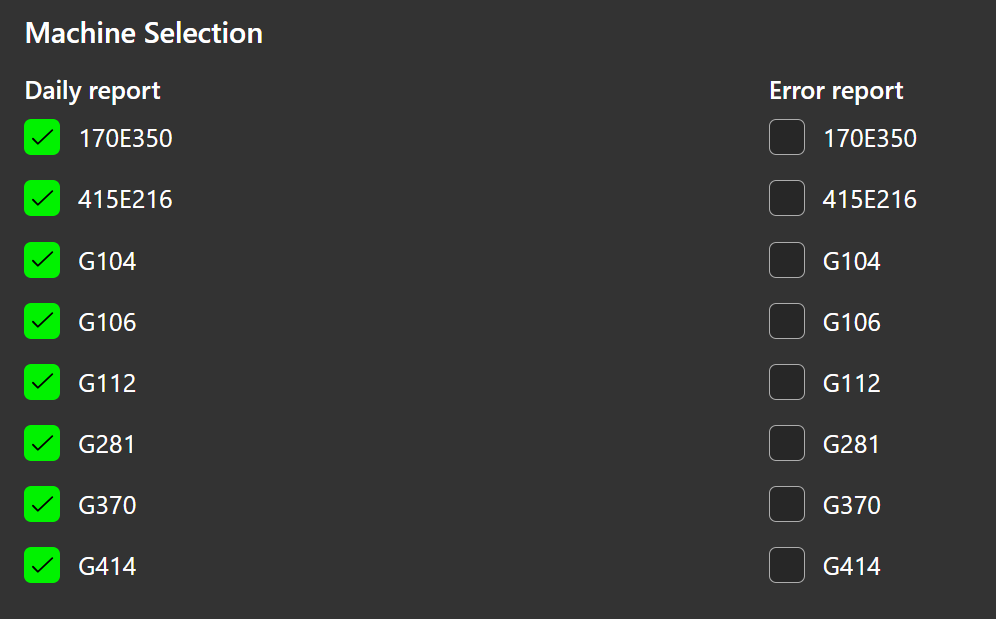
Error report

Sends an error notification for each selected machine when it is in an error state for the duration defined in Alarm Trigger Delay [min].