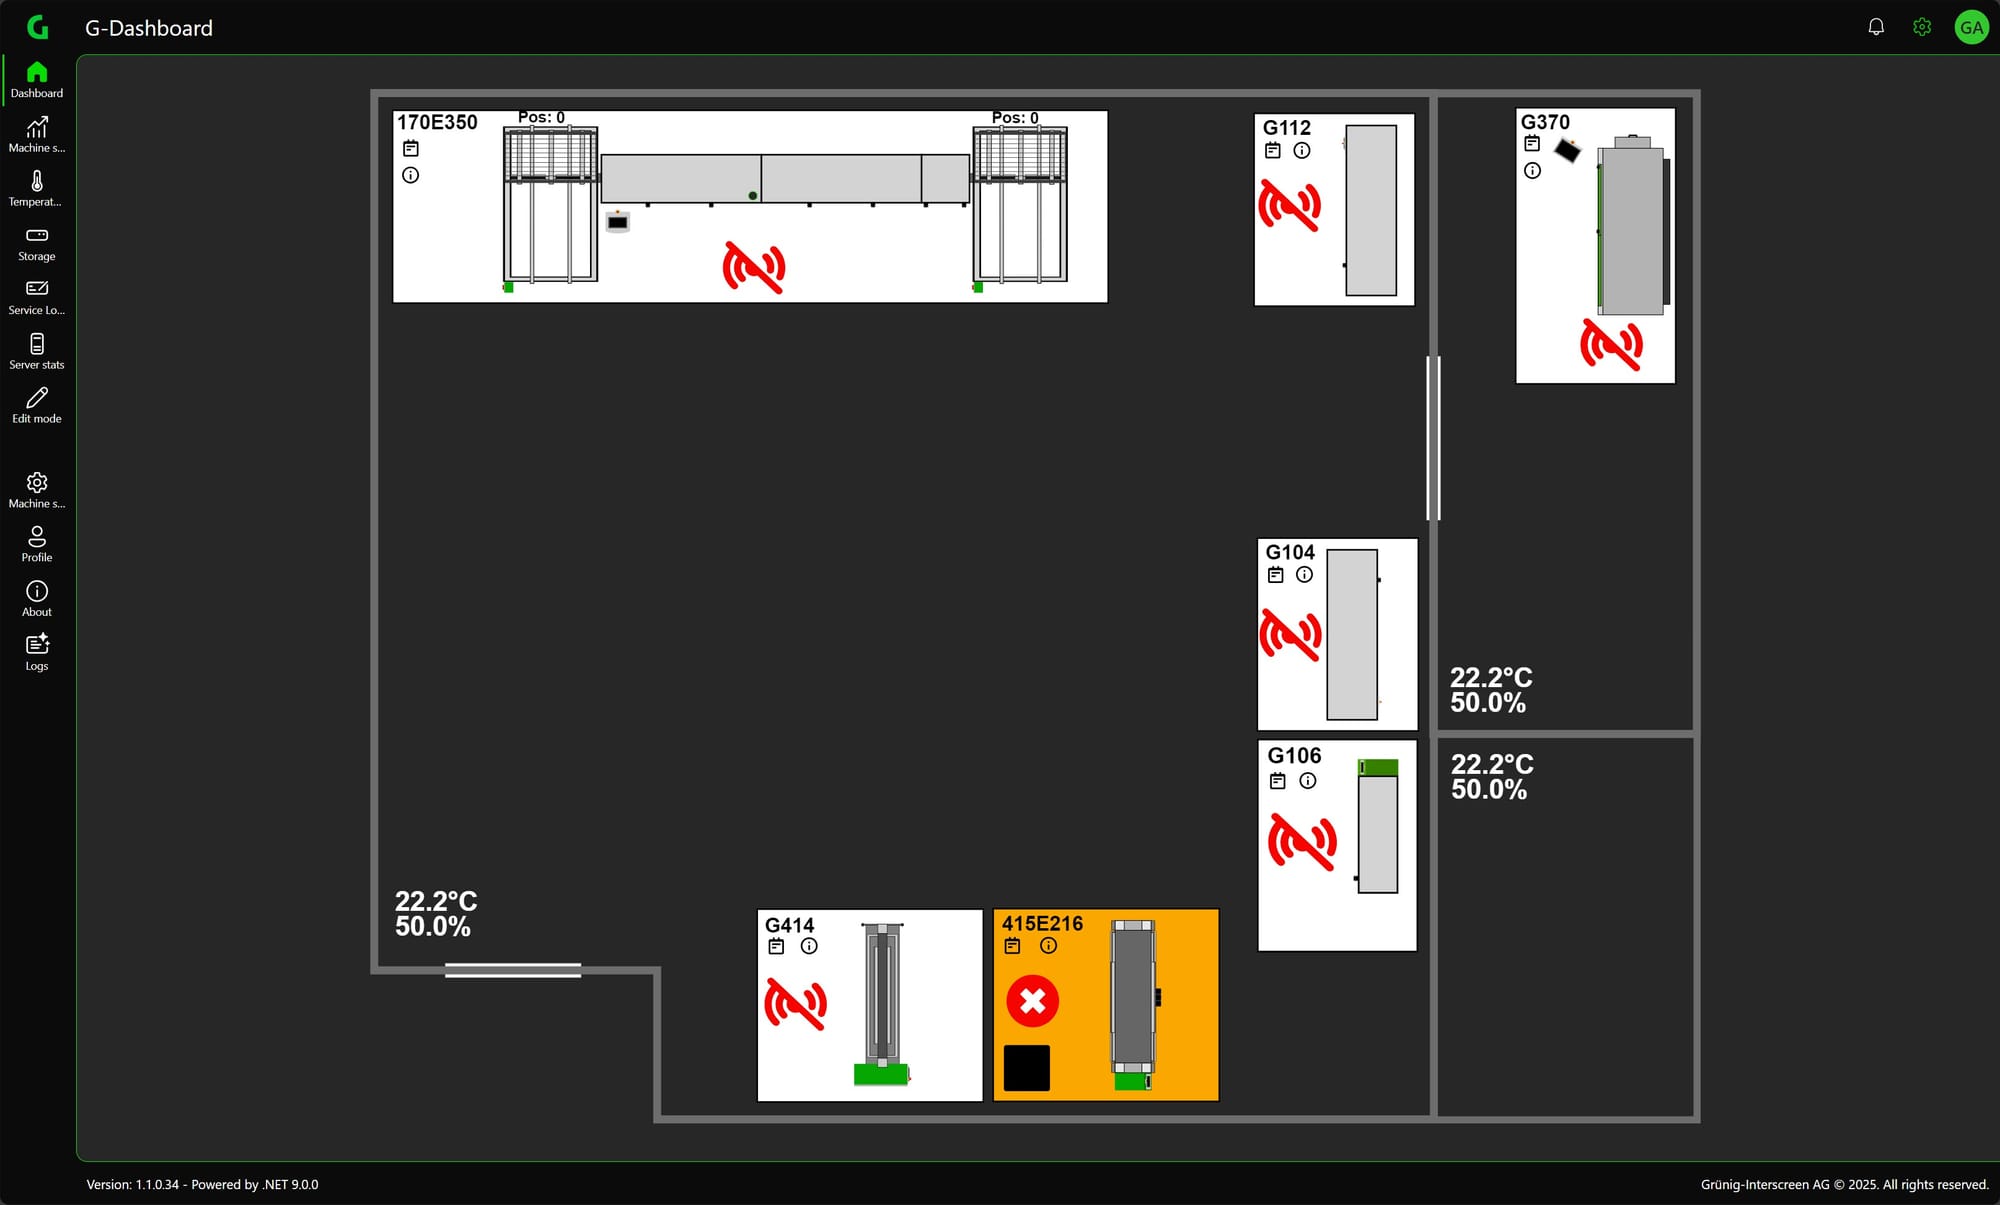
Dashboard
The Dashboard page is the main page. The current states of the machines are displayed here. For a more detailed description of the machine states, please click here.
Moving / scaling
The dashboard can be moved and scaled by touch or with the mouse wheel. The dashboard can be reset by double-clicking.
Popups
There are different popups for different functions.
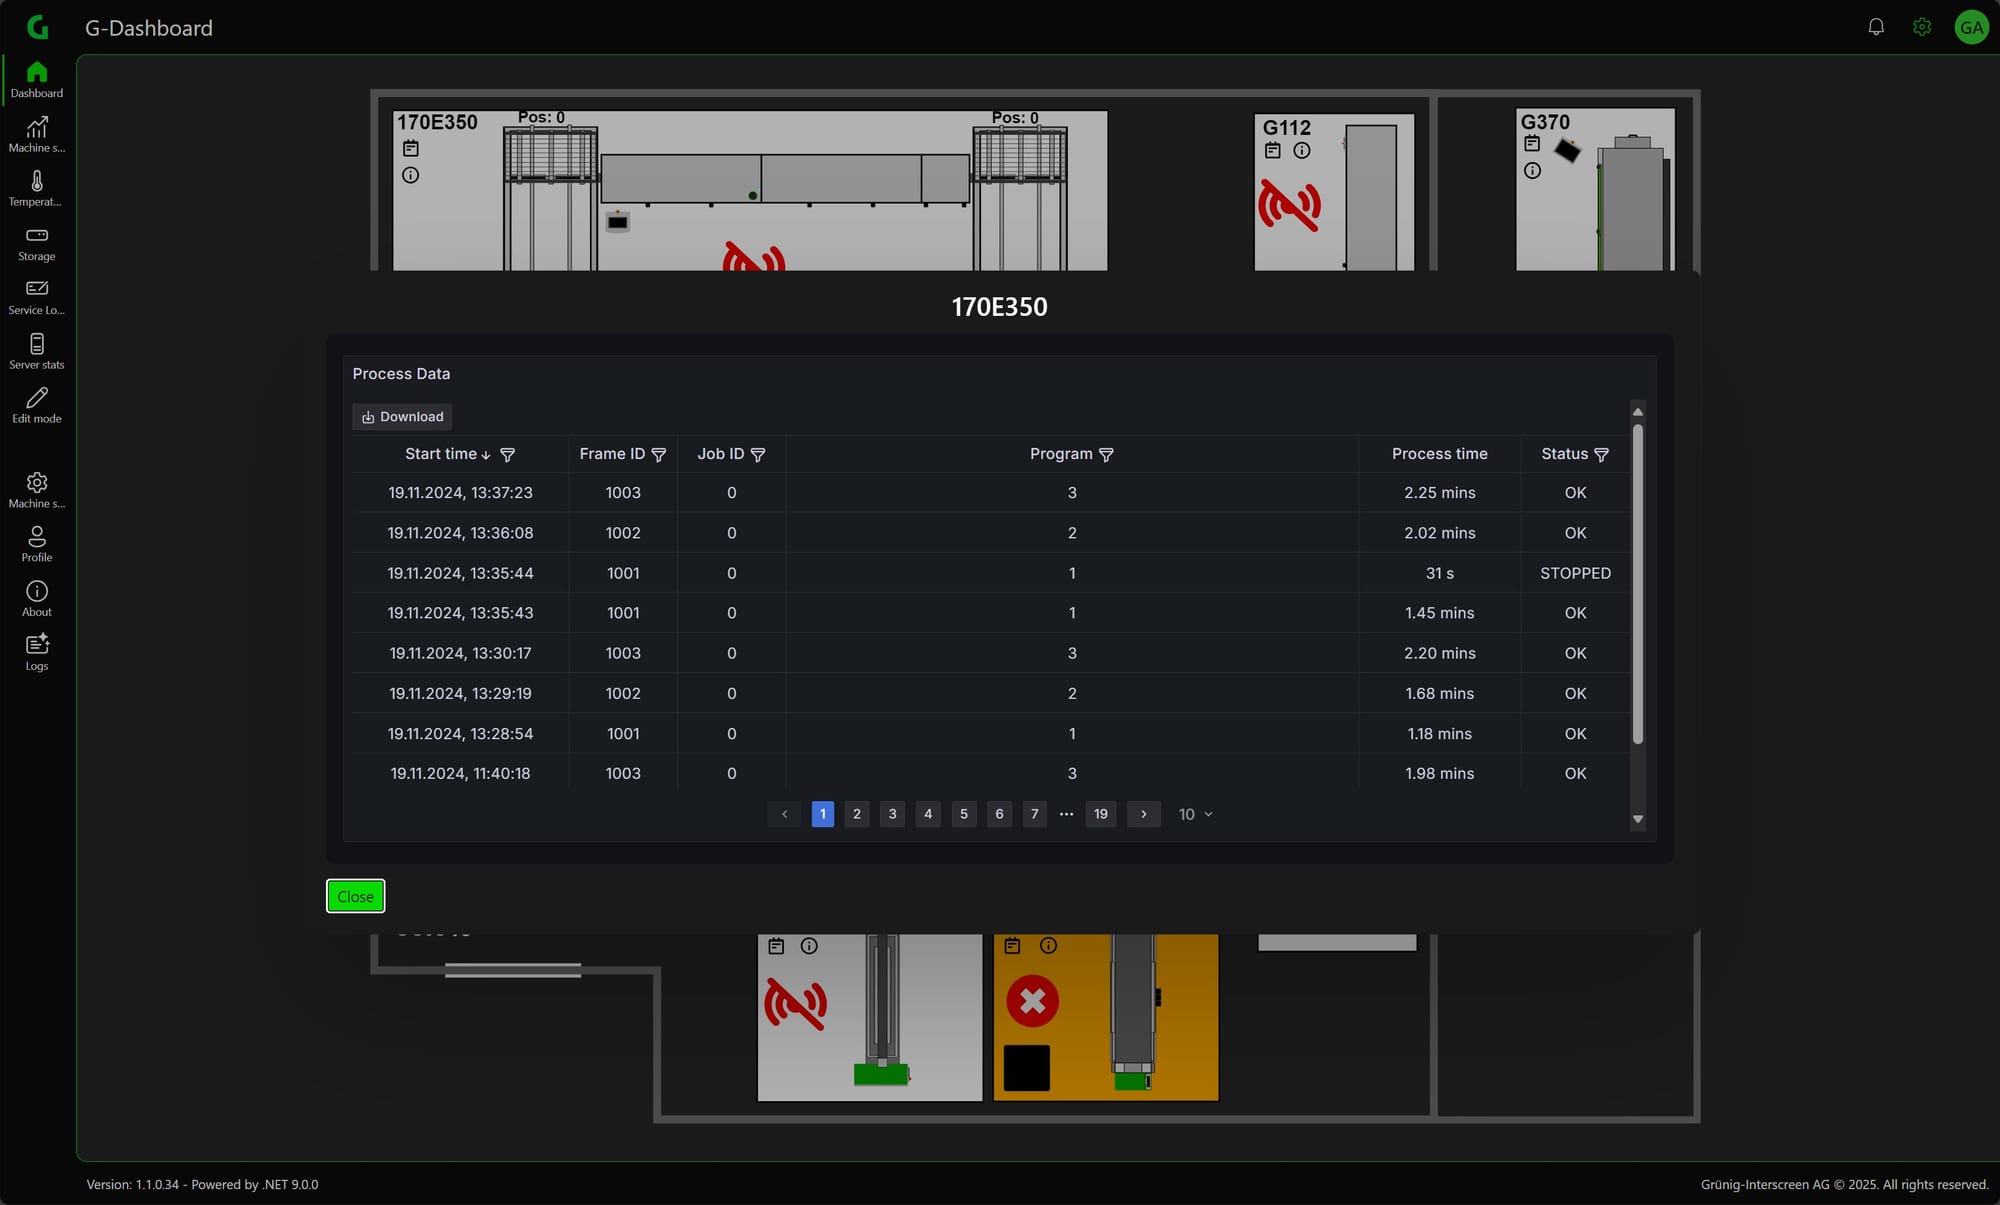
Process Data
If you click on the machine, a popup opens with the process data of the machine.
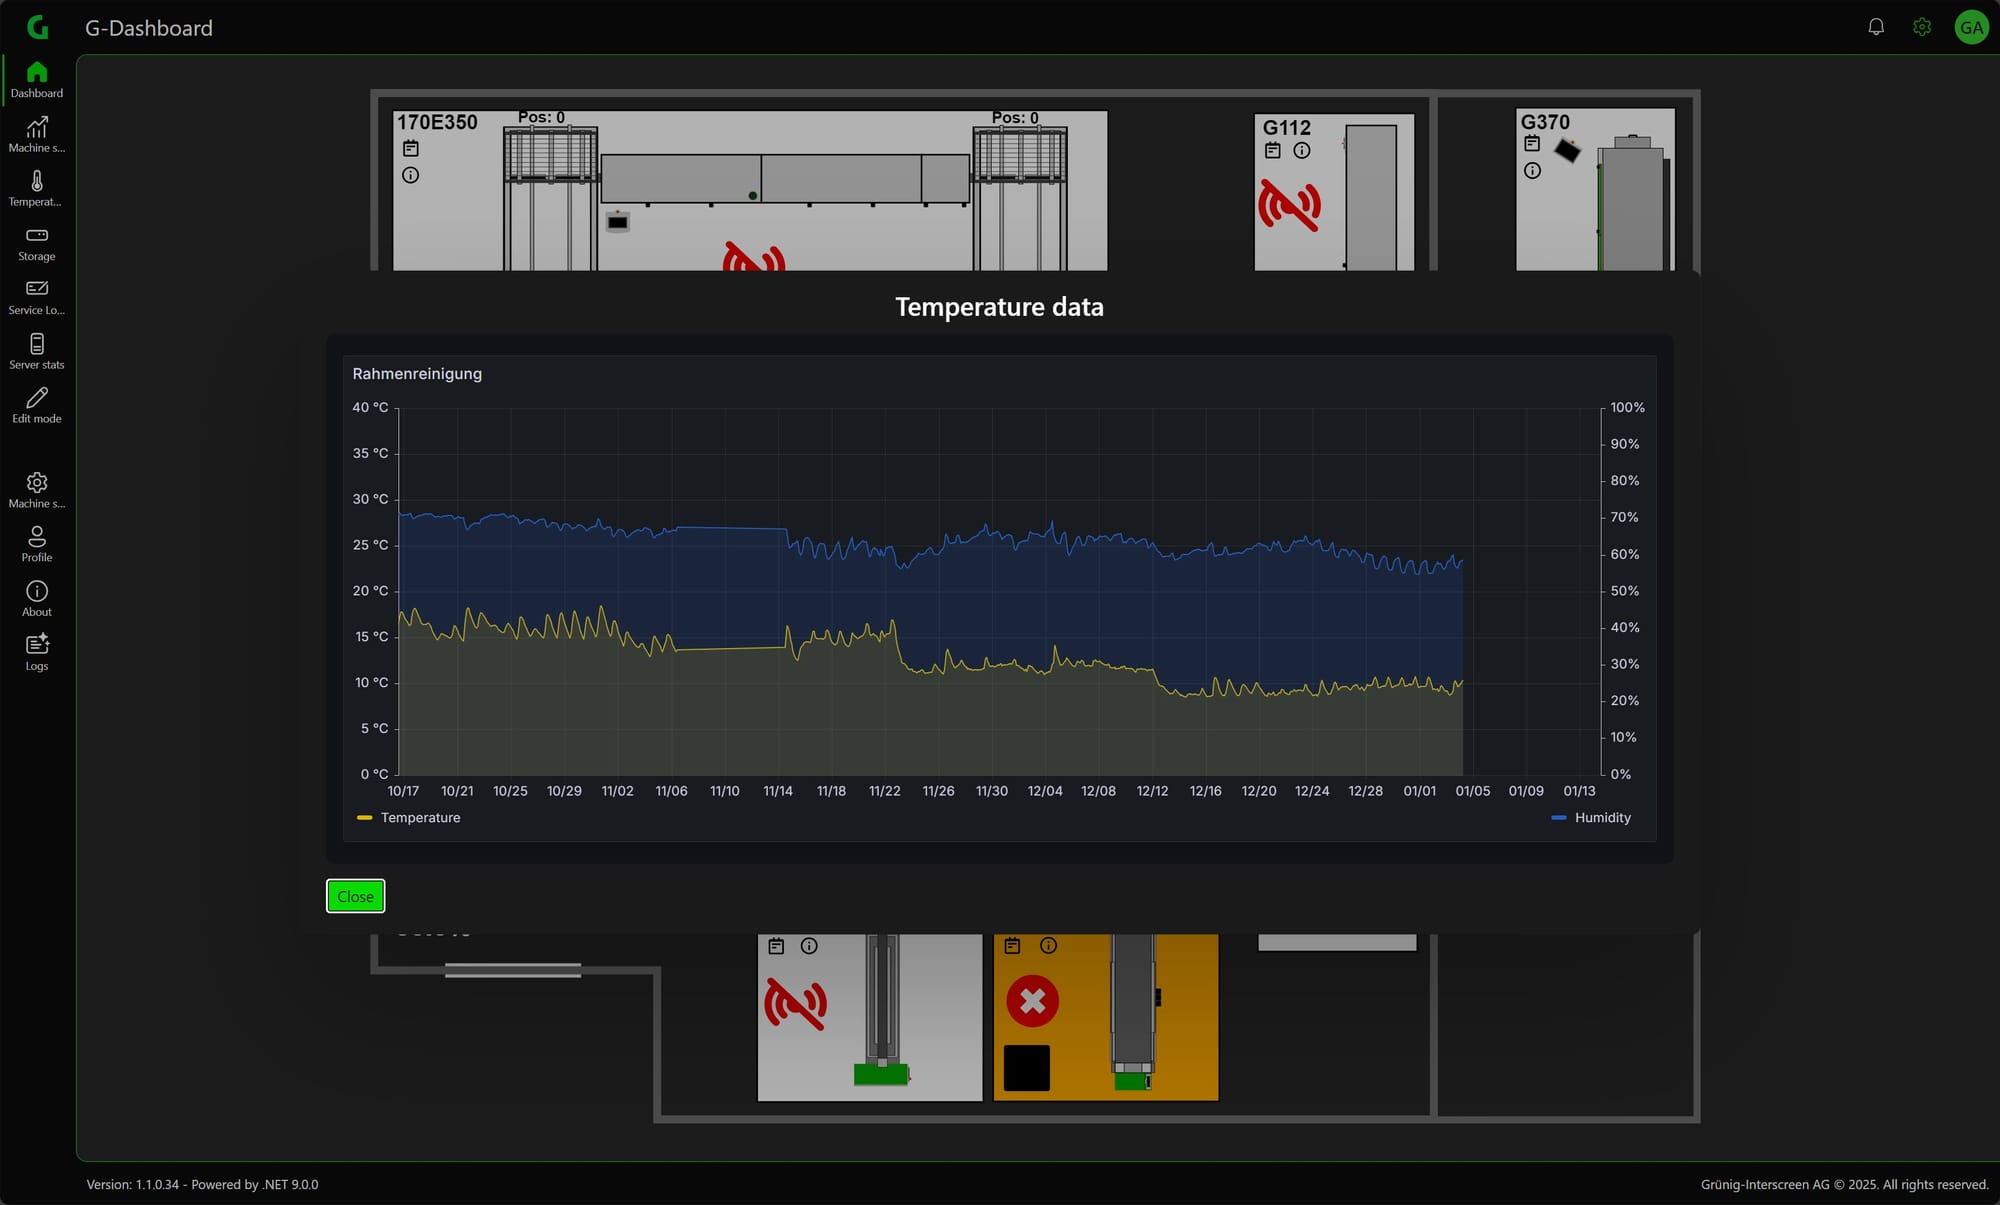
Climate Data
If you have the option with temperature sensors, you can also open a popup with the climate data by clicking on the corresponding climate display.
Magazine Data
To see the frames on the magazine positions, simply click on the corresponding magazine.
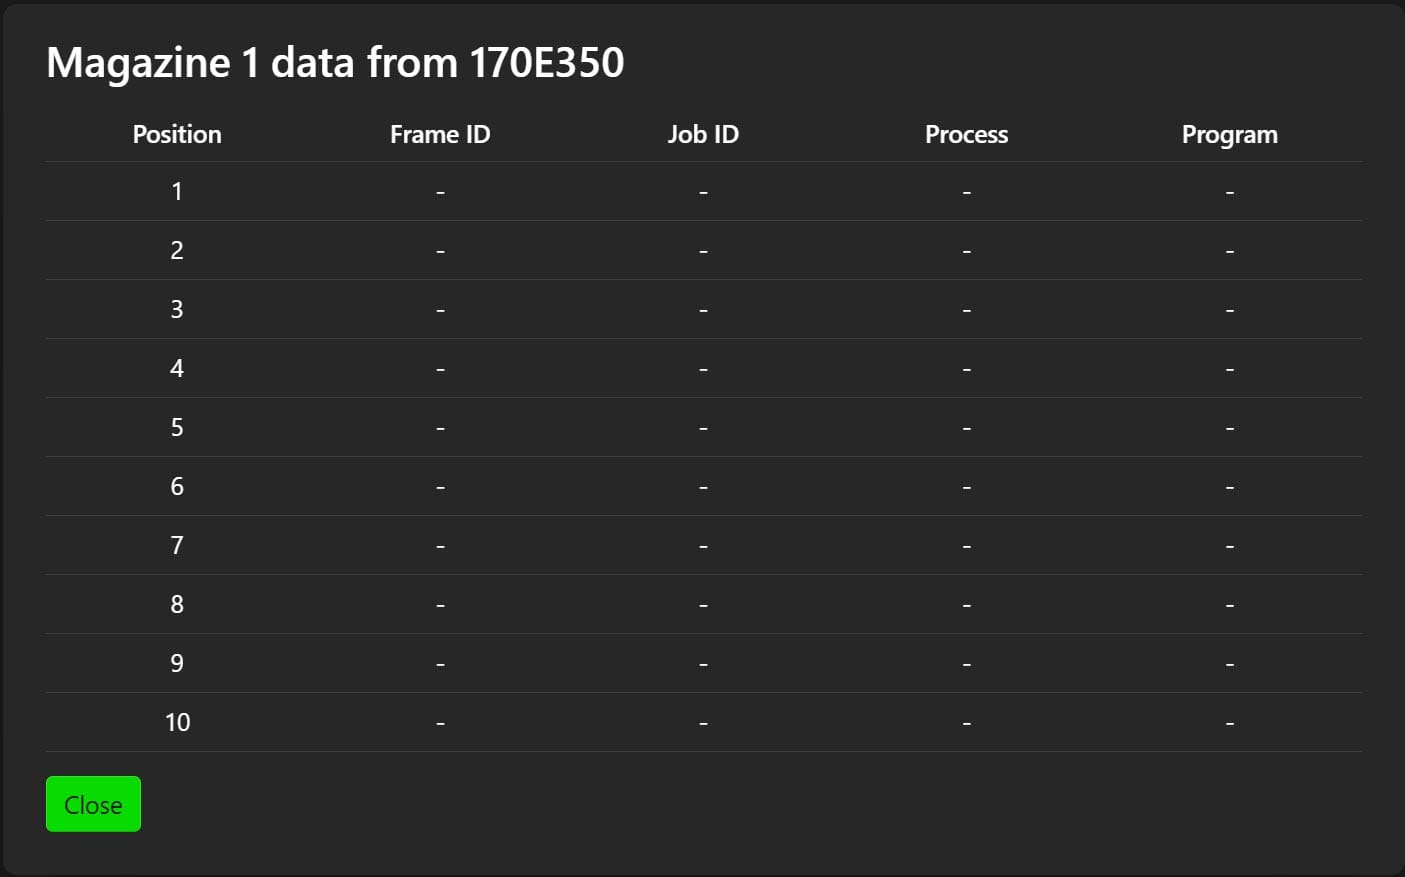
Irrelevant rows can be hidden in the Machine Settings.
Service Protocol
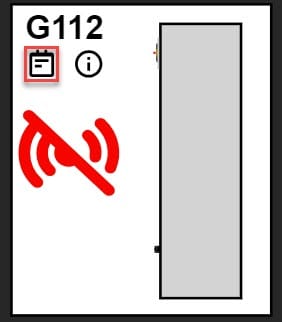
Click on the Notepad icon to open the service log popup. Then you can fill in the service logs directly from here, or of course you can fill in the service logs directly (LINK).
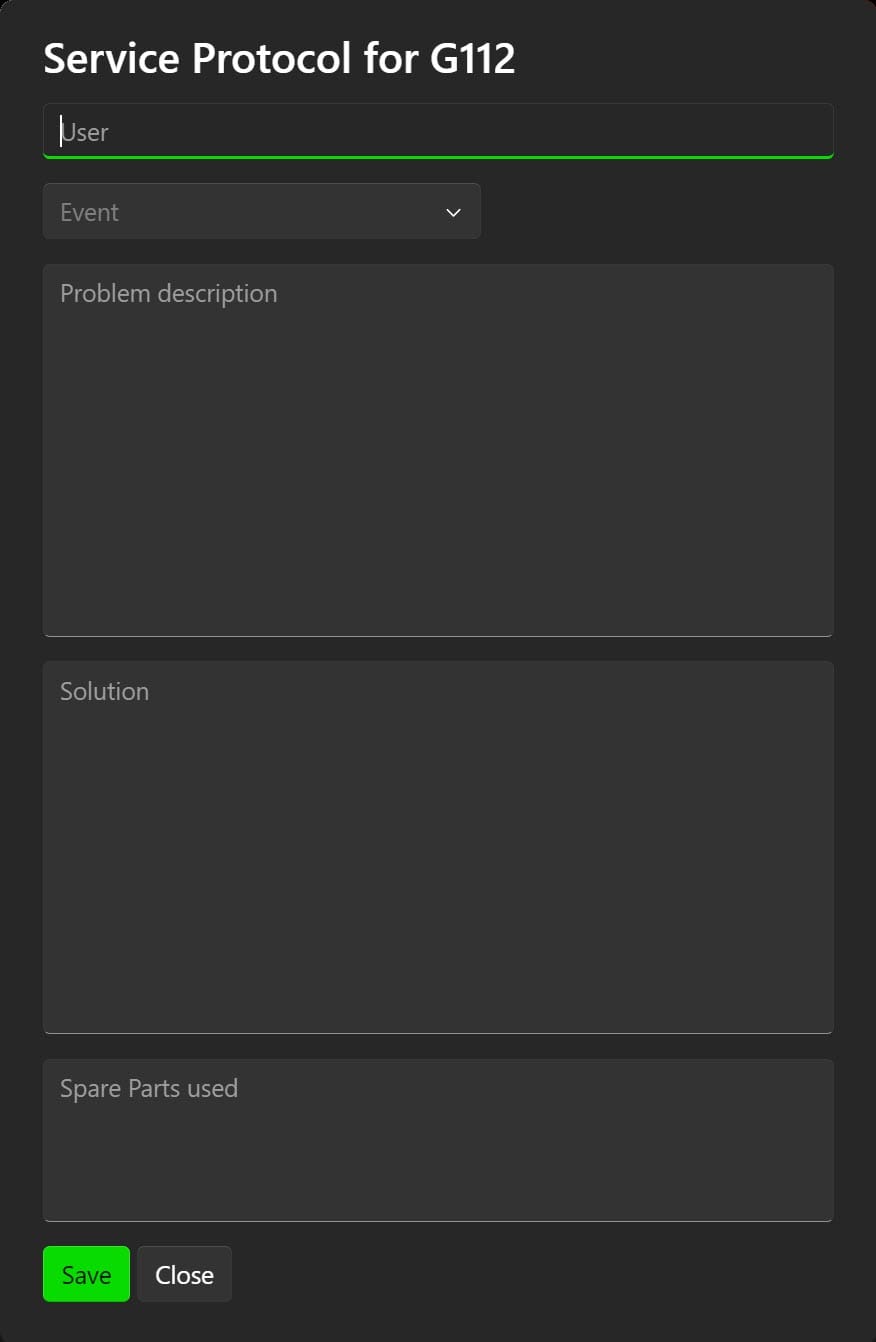
In the event settings you can define what values you want. For example, you can define Error, Warning, Info.
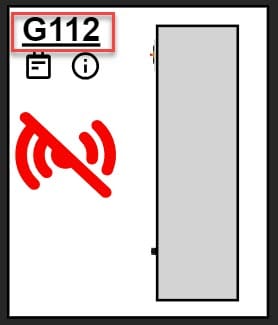
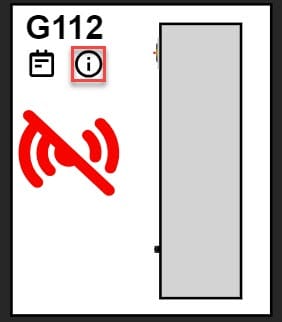
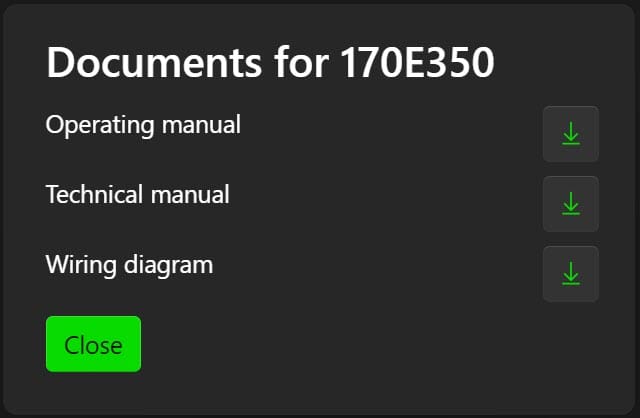
Machine Documents
If you click on the info symbol, you can download the relevant documents for the machine (operating instructions, electrical diagram, etc.).
Machine Stats
To go directly to the machine stats, click on the name of the machine.