Machine stats
The machine data is collected and displayed in the machine stats. A period of time from when the data should be displayed can be selected in the settings.
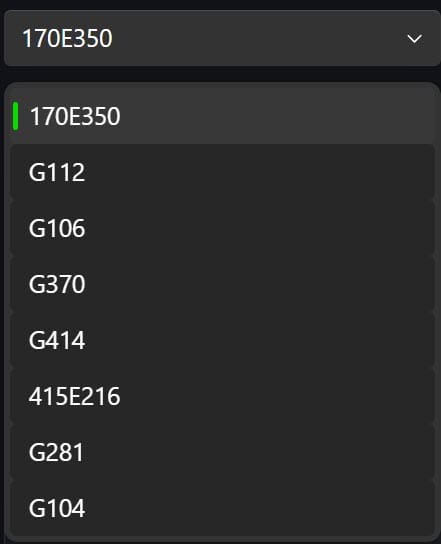
Machine selection
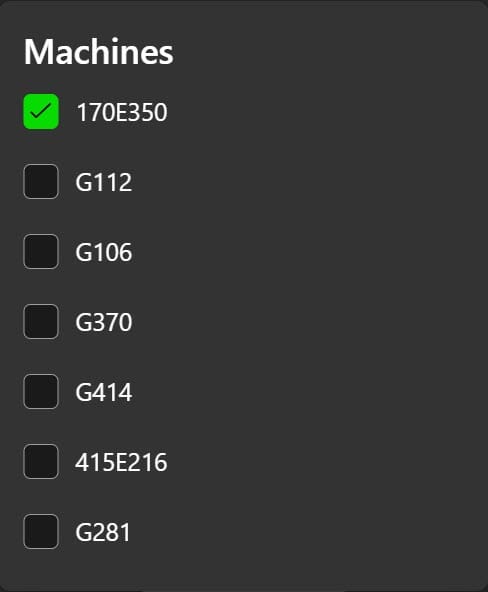
The desired machine can be selected here.
STATE
The current status of the machine is shown here.

COMMUNICATION
- OFFLINE
- ONLINE
MACHINE
- NO DATA: Machine is offline
- AUTO: Automatic operation
- MANUAL: Manual operation
- STOPPED: Machine stopped
OPERATION
- NO DATA: Machine is offline
- RUNNING: Program is running
- PAUSED: Program paused
- STOPPED: Program stopped
ALARM
- NO DATA: Machine is offline
- OK: No alarm active
- WARNING: Warning active
- ALARM: Alarm active
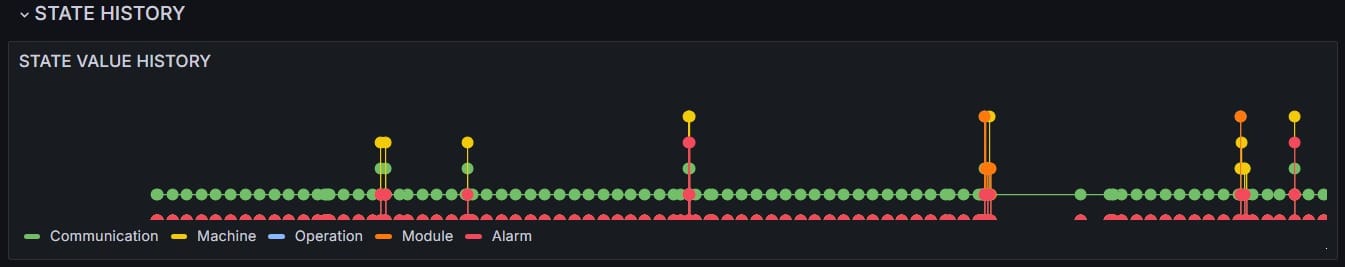
STATE HISTORY
The history of the selected time frame is displayed here.
PROCESS
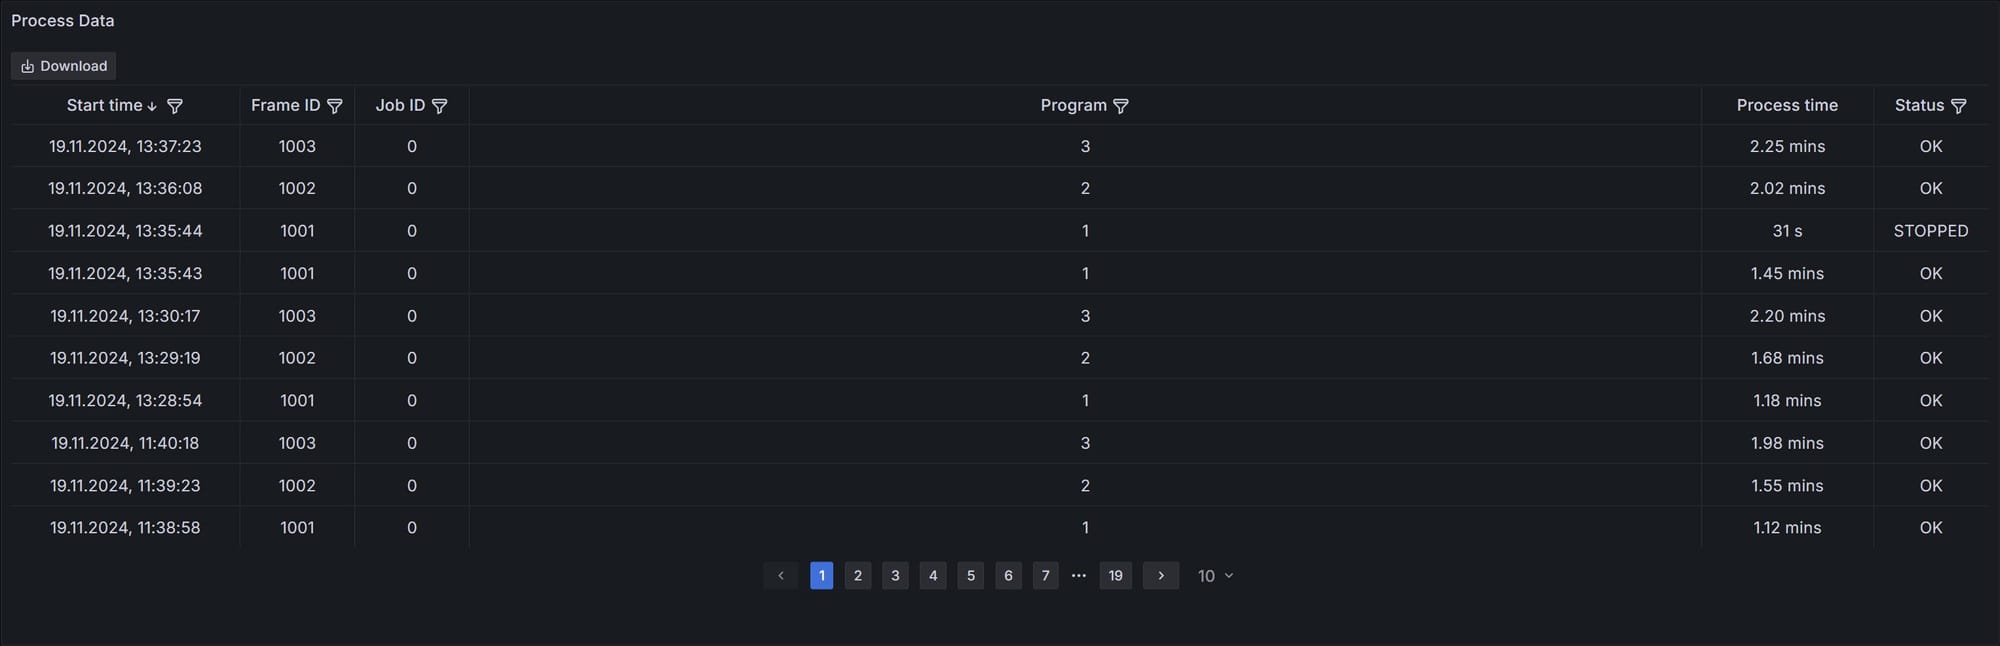
Process Data
The last programs with program start time, frame ID, job ID, program, program runtime and program status are displayed in the process data. This is the same data that appears via the popup in the dashboard
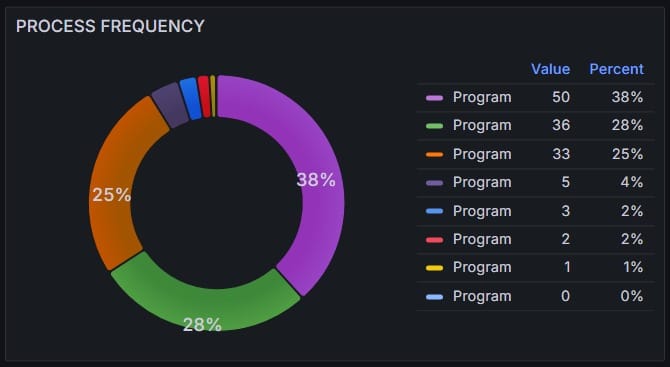
PROCESS FREQUENCY
The diagram shows the most frequently executed programs.
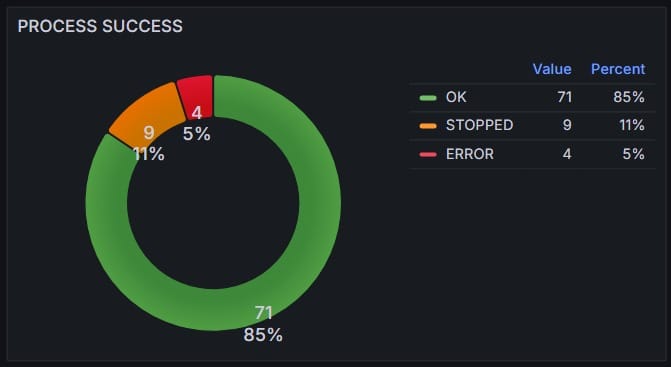
PROCESS SUCCESS
This shows how many programs were successful, aborted and aborted with an error.
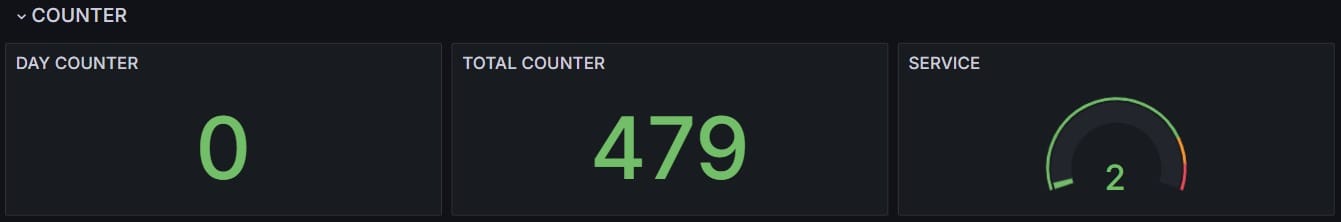
COUNTER
Here you can see how many successful runs have been made today and in total and whether the machine needs servicing. The service is displayed in percent.
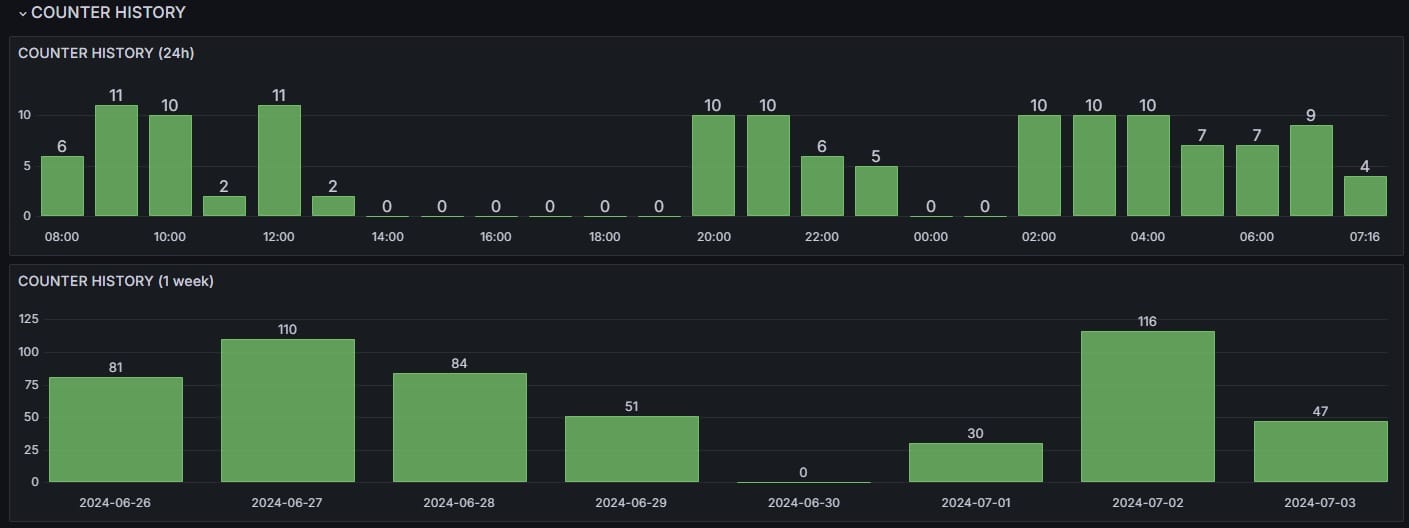
COUNTER HISTORY
The successful runs are displayed again in these graphics. Once from the last 24 hours and once from the last week.
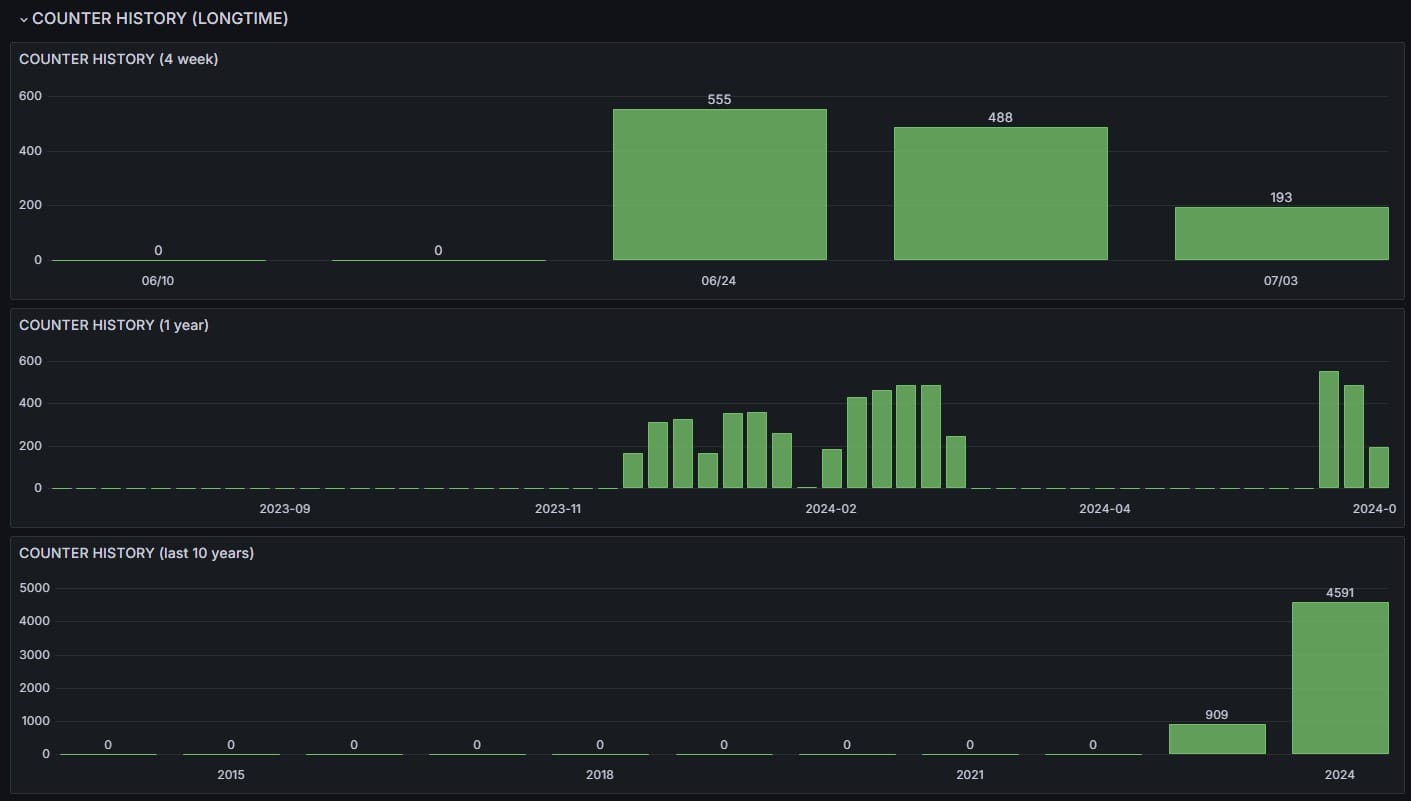
COUNTER HISTORY (LONGTIME)
The successful runs are also displayed here, but only for longer periods.
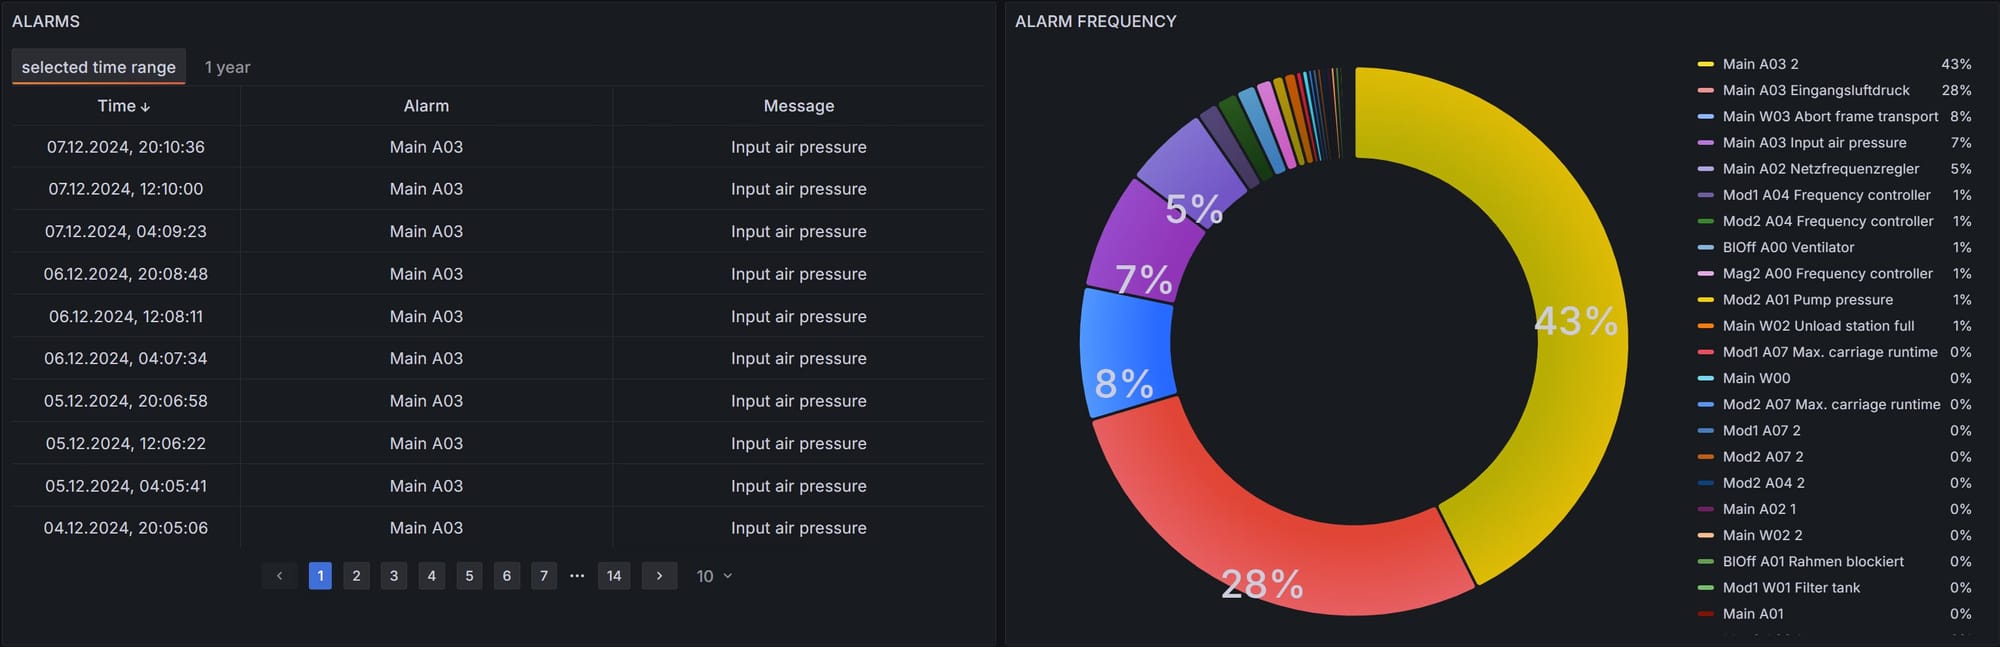
ALARM
The most recent alarms and which alarms were triggered the most are displayed here.
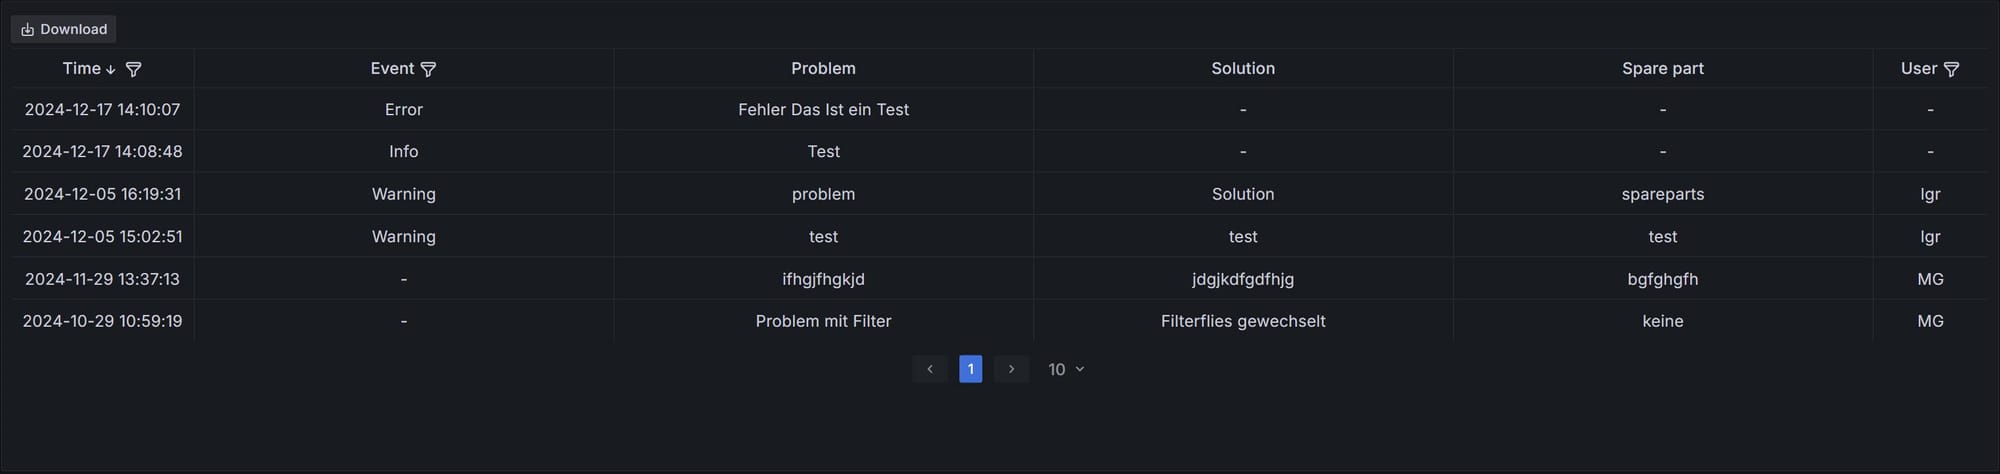
Service Logs
The service logs of the corresponding machine are displayed here again. In contrast to the other display in the service logs, you can filter by line here.